|
|
Information is Power, But Only if it is Used.
A Newsletter from Custom Decision Support Inc. & Lieb Associates Vol. 5 No. 2, Fall 2000
Pricing and positioning are among the most powerful uses of marketing research information. These are ongoing issues that our clients continue to bring to our attention. In this issue, we continue our discussions on using marketing research information with focuses on pricing of new products and techniques for developing positioning diagrams.
Pricing New Products
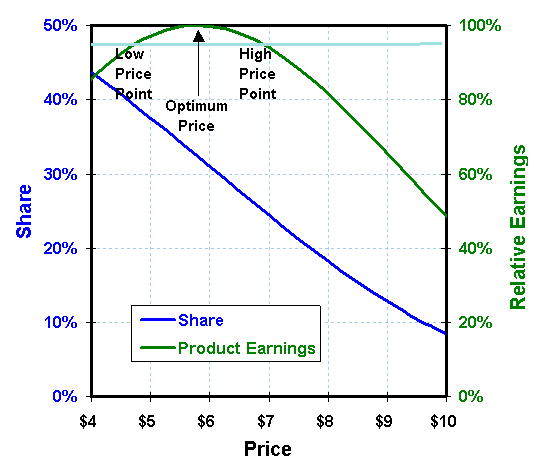
Pricing of new products is becoming increasingly sophisticated with the availability of marketing research data. Pricing studies provide market information from which demand earnings curves are developed. The earnings reflect relative contribution and are the difference between revenues and costs. Below is a typical set of curves for a new product.
|
|
The price that gives the maximum earnings is often referred to as the "optimum price." However, that optimum is based on perfect information and excludes strategic issues that should be considered in choosing the "best" price. It must be noted that there is significant uncertainty as to the actual and realizable earnings. Typically we consider a range of acceptable prices that yield over 95% of the maximum earnings. The lowest price in this range, is referred to as the "low price point" and the highest price as the "high price point."
New Industrial Expendable Products
We have tended to recommend using the "low price point" for new expendable industrial products. These include materials, sub-components and services that are incorporated into final products. The product entry situation tend to include the following characteristics:
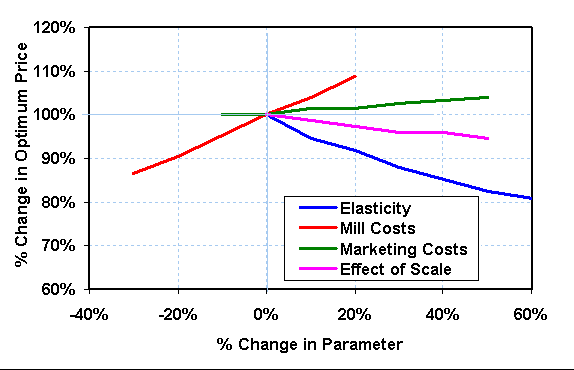
The underestimates of price elasticity and the overestimates of mill costs both lead to over estimates of the optimum price. This is shown below with other potential errors in characteristics.
|
|
In addition, if an error in pricing takes place among new industrial expendable products it is usually preferred to be on the low side. Taken together these factors favor a lower price point estimate as the preferred recommended price.
New Expensive Consumer Capital Products
New premium major consumer products, on the other hand, tend to have the opposite effects. In these cases the characteristics tend to favor the "high price point." These characteristics include:
In all cases, however, we need to consider the strategic issues of positioning and competitive reaction, the tactical issues of distribution and retail reaction and the internal issues of manufacturing costs as well as the customer response captured by pricing marketing research data in setting prices.
Techno -Tips
Naming Data Points
The Techno-Tip column consists of suggestions and comments for data analysis. It is intended to help analysts and managers directly involved in the analysis of business data.
There are many business applications requiring identifying and labeling points on graphs and charts. While EXCEL does not have a "native" way of producing these charts, there is a method of doing so using the Lotus 1-2-3 commands that are emulated by EXCEL. In this section we discuss how to this is done.
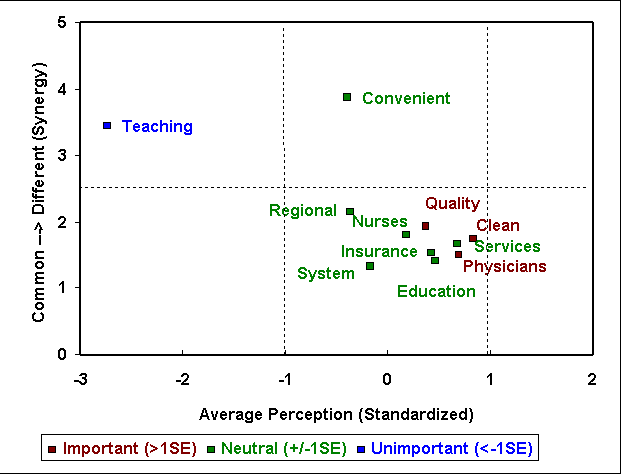
These graphs are generally scatter or X-Y diagrams with points being distinguished by label, color, and size in the case of bubble diagrams. Quadrant maps are a good example as shown below. Up to three variables are shown including perception, importance and competitive advantage. Labels indicate product and service features.
|
|
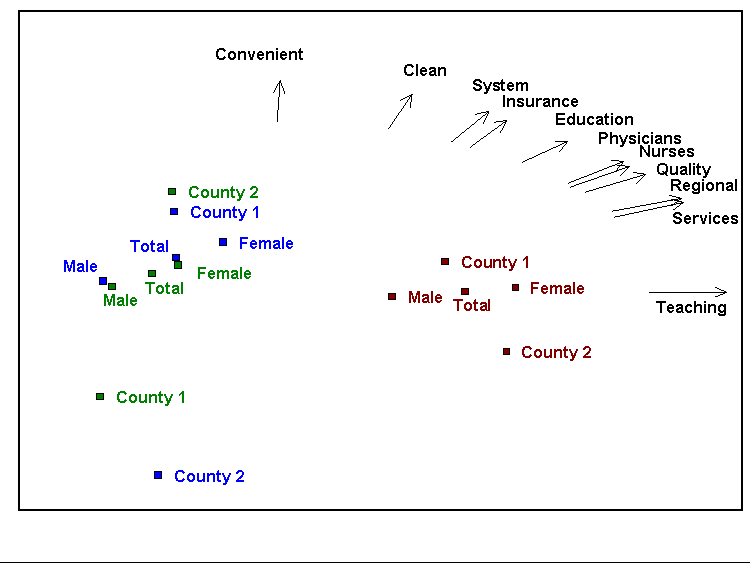
Perceptual or factor maps indicate relative position of groups of customers in respect to product or supplier characteristics. As shown below, the potential customers are grouped into segments based on demographics and the products purchased. The arrows indicate the direction of the product and service features. Because of the high density of information it is critical to identify the points directly on the graph rather than using a legend.
|
|
EXCEL's data-label capabilities only include the data values not an external label that is necessary to produce these charts. However, early (DOS) versions of Lotus 1-2-3 did allow for separate data-labels. These commands are supported by EXCEL through the Help menu as "Lotus Help ...". For developing these charts choose:
Graph>
X... select the range of the X coordinate
A... select the range of the Y coordinate
Type>
XY
Options>
Format>
Graph> if you want a symbol indicate Symbols or Neither if you only want the data-label
Quit
Data-Labels>
A... select the range of the data labels
Quit
Quit
Save>
Attach ... select the range for the graph
Quit
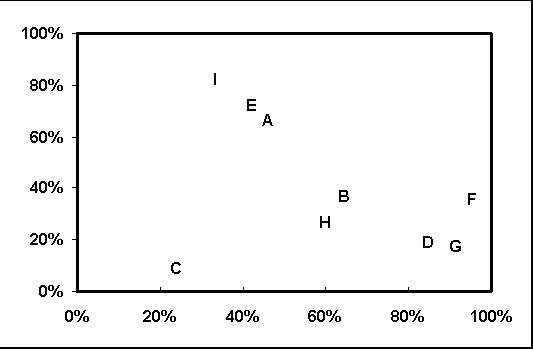
The resulting graph can then be edited using the standard charting commands in EXCEL. If data-labels only are being used, it is necessary to center data-labels using the standard EXCEL charting commends. The following chart is generated in this manner.
|
|
Below is the data used to form this chart.
|
|
Software Review
Statistical Analysis with EXCEL
The Software Review column captures our business data analysis experience with particular types of software packages. It is intended to help our readers in their selection process.
There have been some recent comments on potential inaccuracies in the statistical procedures in EXCEL in the scientific and academic literature. This is clearly a concern to us. However, in our tests against SYSTAT, a well-recognized superior statistical package, the results for regression and descriptive statistic are the same within four decimal points. As such, for practical marketing research applications, we do not believe that this constitutes a problem. Numerical random number generation is always problematic. However, we do not expect, random number generation in EXCEL to be any worse than other numerical methods. Furthermore, it has been found adequate for market simulations.
Commentary
Disappearing Software --
Not with a Bang but a Whimper --
Several years ago we reviewed software to do full profile conjoint analysis for measuring respondent perceived value (Vol. 2 No. 1, Spring 1997, http://www.lieb.com/news21/3rd.htm). For that article we reviewed Bretton-Clark and SPSS software. We had concluded that of the two, the series of "Conjoint" modules by Bretton-Clark were probably the most flexible analysis and design package of this type. And as a stand-alone system, the Bretton-Clark package appeared to be the best available. It appears that the Bretton-Clark software is no longer available. They do not appear on the World Wide Web nor do the answer their published phone numbers. This is unfortunate since the software represented a set of excellent solutions for the use of what is otherwise a fairly complex, fault intolerant but highly useful methodology.
Its demise may represent a trend in application software development and a consolidation in the statistical software market. Many of the independent statistical software packages have been bought by SPSS, Inc. including SYSTAT. Many of the previously independent decision support packages are being marketed by Palisades Software. This consolidation may reflect the increased development difficulty in producing packages compatible with Microsoft Windows operating systems. While Windows and the more powerful processors that are now available provide great flexibility and improved ease of use, they make production of application software difficult and expensive. The result appears to be a decline in the extent of the offerings. This may be inevitable, but we mourn the loss of old friends and lost opportunities.
What's New
As noted from the last newsletter, I have been recovering from a badly broken leg. This has been a long recovery process. However, I'm now more or less back doing consulting work and teaching at Drexel University at present and at Villanova University next spring.
In the spring, I will be teaching a new graduate MBA elective course on "E:Marketing." This course will include the elements for developing a e:commerce business entity. As you might expect, I am taking an analytical perspective on the topic. Several research and commercial organizations have volunteered to provide data on the characteristics of such businesses and the markets they serve. I plan to share some of the results of that analysis with you in the spring's newsletter.
I appreciate any comments and contributions from you. You can get in touch with me at Custom Decision Support, Inc.,