Information is Power, But Only if it is Used.
A Newsletter from Custom Decision Support Inc. & Lieb Associates Vol. 1 No. 1 Spring 1996
Our world is more competitive than ever. With trillions of dollars invested in information technology, it is critical that we use information as effectively as possible. The purpose of this newsletter is to provide the business management, research and information technology communities with insights into using market and business information. This first newsletter is devoted to new business development, an area in which we have consulted for over two decades.
Cost reduction programs can only go so far to secure profits. Ultimately, profits must be derived from new businesses. However, new businesses do not just happen; they have to be built by a diverse group of professionals, including R&D, sales, manufacturing and management. Most of our activities over the past 25 years have been in new business development. We have found from our experience and those of others that there are four key determinants that make an internally developed new business program successful.
1. The Right to Fail and the Need to Focus
New business development is a probability game. "You have to kiss a lot a frogs to find a prince." The chance that any single market or product concept will succeed in its present vision is small. Ideas evolve and change. New business programs fail when inordinate amounts of effort are absorbed into projects that should be terminated early. There is a critical mass of effort required to make a business grow. The process of growth is evolutionary. This requires resources. If too many product concepts are being developed or too many market applications are being pursued, resources are spread too thin to do the job properly. Only by prioritizing opportunities, terminating losers and focusing can the development effort be efficient. Often fewer are better than many. The key is to know which ones to work on.
2. Market Oriented
Development is uncertain in terms of the potential outcomes and what direction projects should take. Most of that uncertainty is captured in the knowledge of the market. Robert Cooper of McMasters University has researched new product development and has concluded that marketing and market knowledge is the major determinate of success. We agree with that finding. A market orientation is critical for success. Objective knowledge of the market is needed. We have found that independent marketing research is usually necessary to obtain the unbiased objective evaluation. Sales people and business developers, as well meaning as they are, neither have the skills nor are sufficiently objective to obtain this type of information.
3. Financial Numbers
Development people learn to live with uncertainty. Unfortunately, financial management tends not to be tolerant of this level of uncertainty and demands forecasts beyond reasonable precision for new businesses. With sales data, methods exist to produce reasonably precise forecasts, as discussed in the next article. However, if no sales have yet been made, the forecasts merely track expected market potential from products and markets that are still being developed. Financial analyses can be used to summarize what is known about the market. As such, they are powerful planning tools, but excessive focus deflects attention from meaningful development effort. The major problem is that new business forecasts imply a stability and certainty which is dyfunctional to the development process. With such promises to management, there is a reluctance to change objectives.
4. Working on the Right Things
The bottom line in business development is working on the right things. This not only means on the right product concepts and markets but the right activities; seeking out the right information and doing the correct chores. People tend to do those things that they know how to do. R&D people want to do experiments; management people focus on numbers; and marketing people on sales contacts. What are the right activities for a business development program must be based on the critical factors for success rather than the historical and functional interests of the people involved. We have found that an objective development process can force the development team to address critical issues. We have developed such processes as planning guide books. You can link to an outline of those guides and workbooks.
Forecasting sales or technology substitution during the early stages of new product introduction is extremely difficult but critical. Over the past 20 years we have developed a number of tools that help in the forecasting of new product sales. These tools are used for primary forecasts, for auditing field sales forecasts and as strategic planning tools. The General Sales Growth CurveSM (GSGC) is among the most powerful of these tools.
The General Sales Growth Curve is a simple, effective penetration model applicable to the growth phase of new products and technologies. Tests with over 300 products and technologies have been shown to be effective for forecasting sales of expendable products when as few as 4 annual data points are available. The General Sales Growth CurveSM is a simple (two parameter) model and represents a declining proportional growth. Like the exponential model, it is applicable only to the growth phase of product and technology life cycles.
With sparse data, only a few parameters can be estimated. Under these circumstances the logistic or "S" shaped curve can not be used since it requires too much data. Comparison with the exponential growth curve representing constant proportional growth indicated that the General Sales Growth Curve gives significantly better predictions.
The General Sales Growth Curve can be fit to data using linear regression.. The potential line in the attached figure is derived from the curve fit data and represents the asymptotic limit of growth. You can link to a white paper detailing how to do the data fitting and interpretation.
The Techno-Tip column consists of suggestions and comments for data analysis. It is intended to help analysts and managers directly involved in the analysis of business data. This article goes into more technical detail than usually covered in general business literature.
A lot of marketing data comes as tables representing the percentage of a sample that answered a question one way or another. The confidence range of this data represents its precision. Computing that range has been problematic. Few marketing information providers supply confidence interval information with their tables. Traditionally some multiple of the standard error is used to imply its precision.
Standard Error Around P = [P x (1-P)/#]^0.5
where P = expected value from the sample (i.e. 25%), and # is the sample size. This implies that the uncertainty is the same above and below the value. However, the confidence interval around percentages is not symmetric.
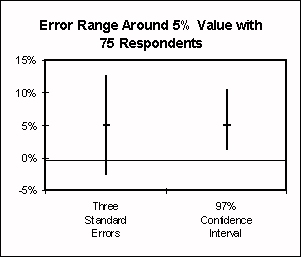
We have found a convenient way to compute the confidence interval using Microsoft EXCEL. The correct measure of the confidence interval uses the binomial distribution. Or more precisely, we need to invert the binomial distribution to compute the value that would give a confidence level, (i.e., 90%). Unfortunately, the binomial is a discrete distribution which is not easily inverted. However, the beta distribution, available in EXCEL, is a continuous analogue to the binomial and can be inverted. The following EXCEL function computes the confidence interval.
Confidence Interval = BETAINV{Level,[P #],[# - (P #)+1],0,# }/ #
where Level = confidence level (i.e., 90%). For example consider a 90% confidence interval around a 25% expected value from a sample of 200 respondents. The upper and lower intervals would be:
BETAINV(.90, 25, 76, 0, 100)/100 and BETAINV(.10, 25, 76, 0, 100)/100
These would result in values of 30.3% and 19.4% respectively. Isn't EXCEL wonderful!
The Software Review column captures our business data analysis experience with particular types of software packages. It is intended to help our clients in their selection process. We would appreciate any comments on these packages and others listed for future newsletter reviews.
This world is very uncertain. Business and market models can be easily built using spreadsheet packages like Microsoft EXCEL and Lotus 1-2-3. Add-in tools to these spreadsheets expand their use to capture risk and uncertainty. These packages add to electronic spreadsheets the capacity to do probabilistic simulation (monte carlo) analysis, @Risk, and fitting probability distributions to data, Best Fit.
These tools greatly simplify risk analysis on any spreadsheet model. Due to the nature of spreadsheet models this type of analysis is inefficient and therefore may require extensive computing time. @ Risk provides a number of useful output tools such as scenario analysis. However, at this review, it does not give two dimensional probability surfaces that are useful in examining risk associated with sales and earnings together. Additional tools have to be used for that type of analysis. This reviewer is not familiar with any other add-in package that gives similar capabilities to spreadsheets.
Probabilistic simulators can be developed in Microsoft EXCEL without the use of @ Risk or BestFit. However, this would require significant programming using its "macro language." Alternatively, dedicated programs can be written for probabilistic simulation using procedural languages such as Microsoft QuickBASIC or VisualBASIC. These packages have been recently reviewed and used by this analyst. I have found them relatively easy to install and use. They are fairly inexpensive and I can recommend both of these packages as development tools. They are published and distributed by Palisade Corporation, Newfield, NY 14867, and distributed through SciTech International.
I hope the articles and editorials in the newsletter will stimulate discussion, provide new insights and help drive the industry toward more effective use of business information. I hope to publish this newsletter twice annually. Future newsletters are planned to include articles on: (1) predicting market share (2) measuring price sensitivity, (3) modeling markets, (4) mining customer satisfaction data, and (5) using the Internet. I appreciate any comments and contributions from you. You can get in touch with me at Custom Decision Support, Inc , Telephone (610) 793-3520. Fax (610) 793-2531, or at genelieb@lieb.com.
Gene Lieb (Editor and President)